
Technical analysis
Learn technical analysis, an essential tool for traders who want to maximize the use of price and volume data to make market decisions
Basic principles of technical analysis
History is repeated
One of the key principles of technical analysis is that the behavior of market participants repeats itself. Certain patterns and patterns on the charts, such as head and shoulders or double bottoms, occur over and over again, providing an opportunity to predict future movements
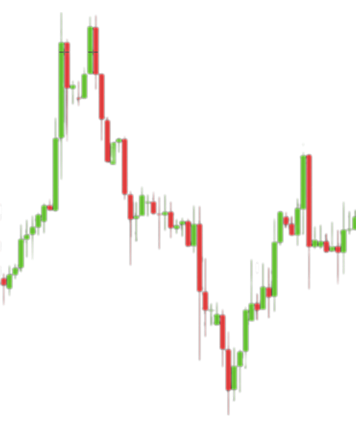
Charts
Help to analyze past price movements and predict future ones.
- Line chart – shows price dynamics in the form of a line.
- Japanese candlestick chart – provides information about the opening price, closing price, highs and lows for a specific period.
- Bar chart is an analog of Japanese candlesticks, but with a different visual representation.
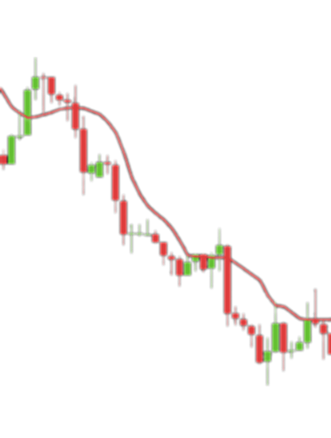
Indicators
Indicators help traders identify trends, oscillations and overbought/oversold markets.
- Moving Averages — smooth out price fluctuations to reveal general trends.
- RSI (Relative Strength Index) — shows the strength or weakness of the trend and possible reversals.
- MACD (Moving Average Convergence Divergence) — helps to determine the moments of entering and exiting a deal based on the crossover of moving averages.
Benefits of technical analysis
Precise entry and exit points
Indicators and levels help traders pinpoint the exact moments to open or close trades
